

Land Ecosystem Atmosphere Program (LEAP) - Boyagin OzFlux Flux Tower Site

- Info
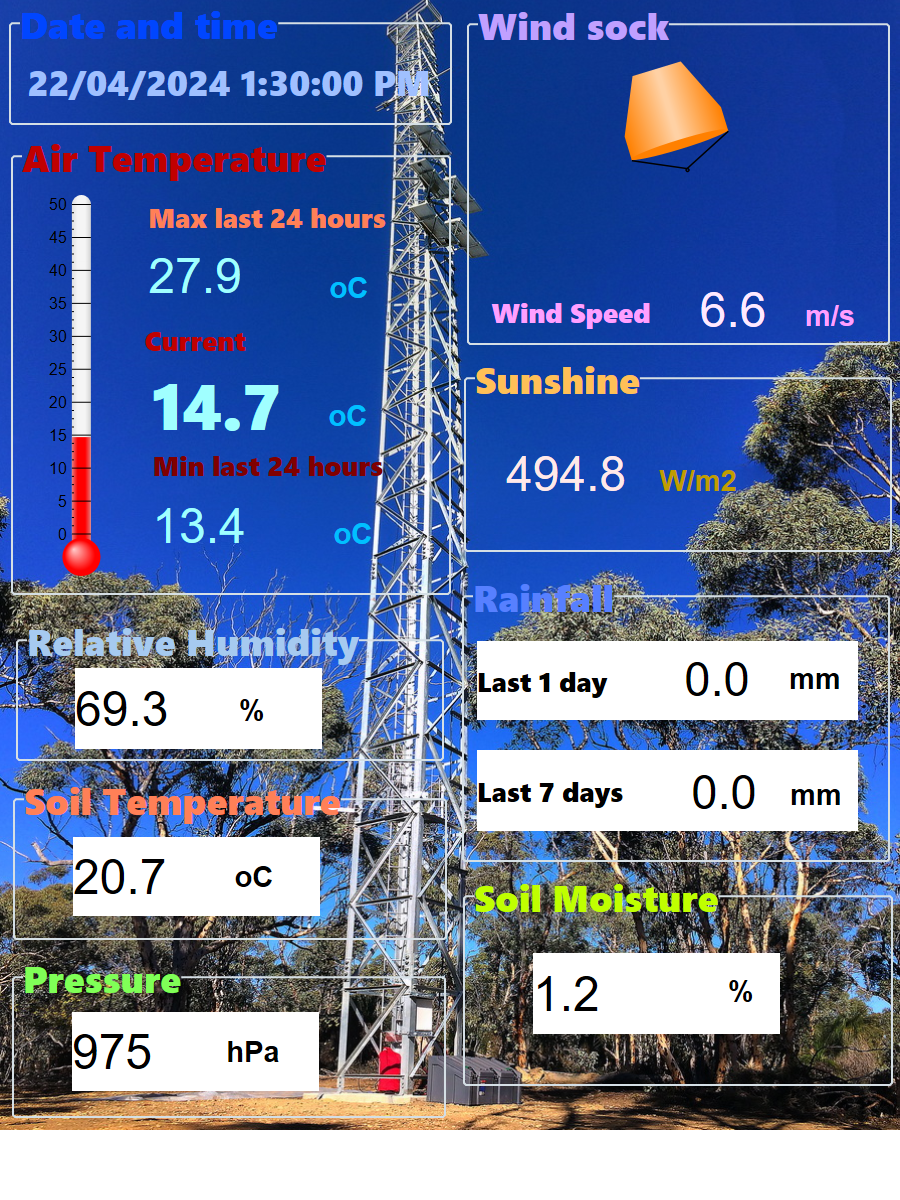
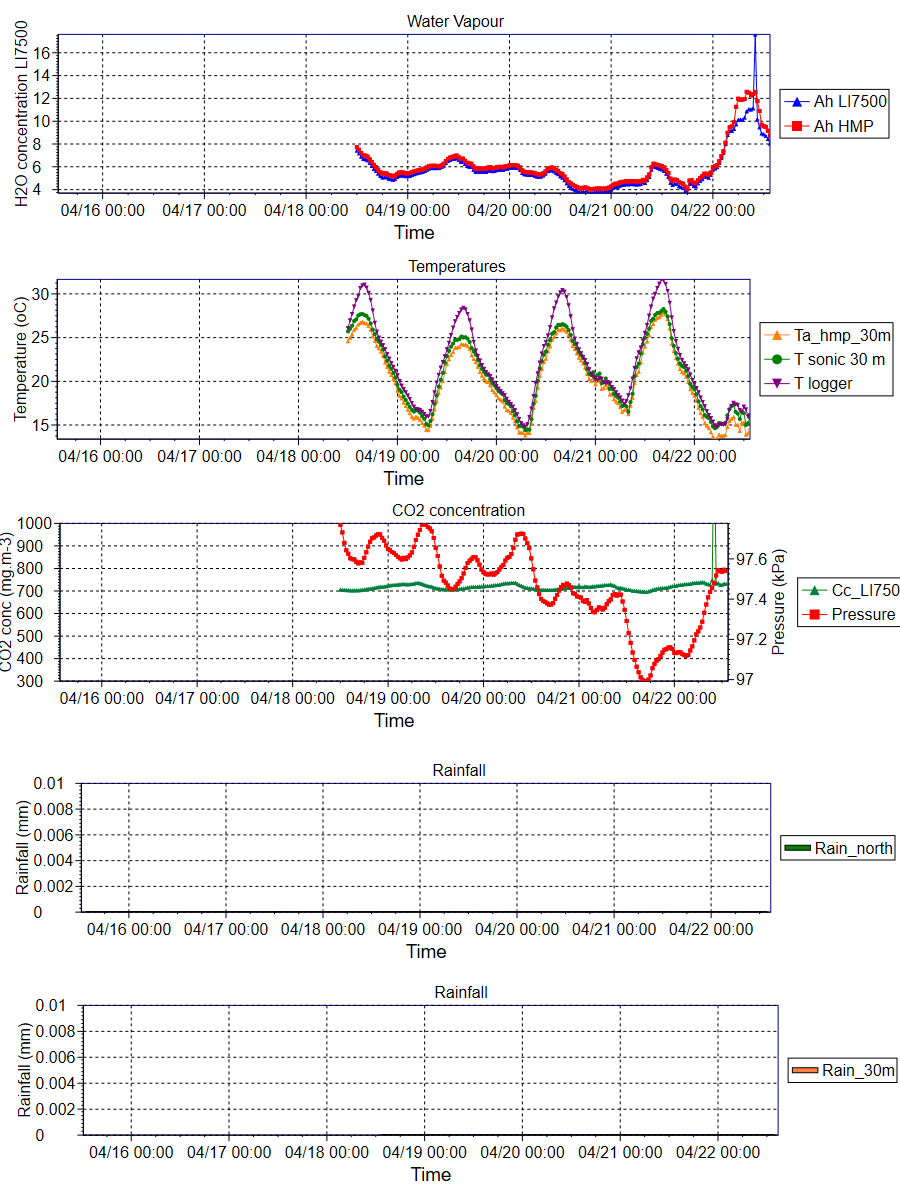
- Weather
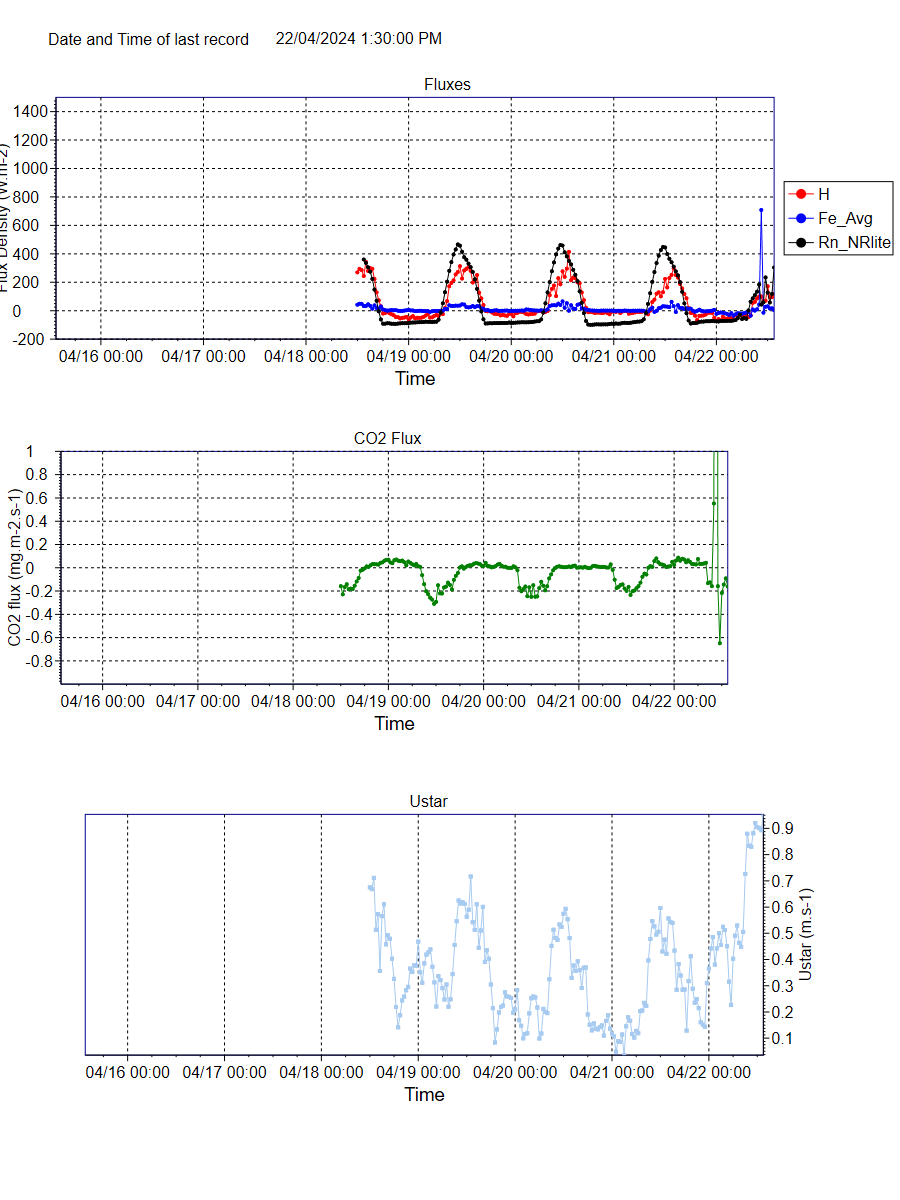
- Flux
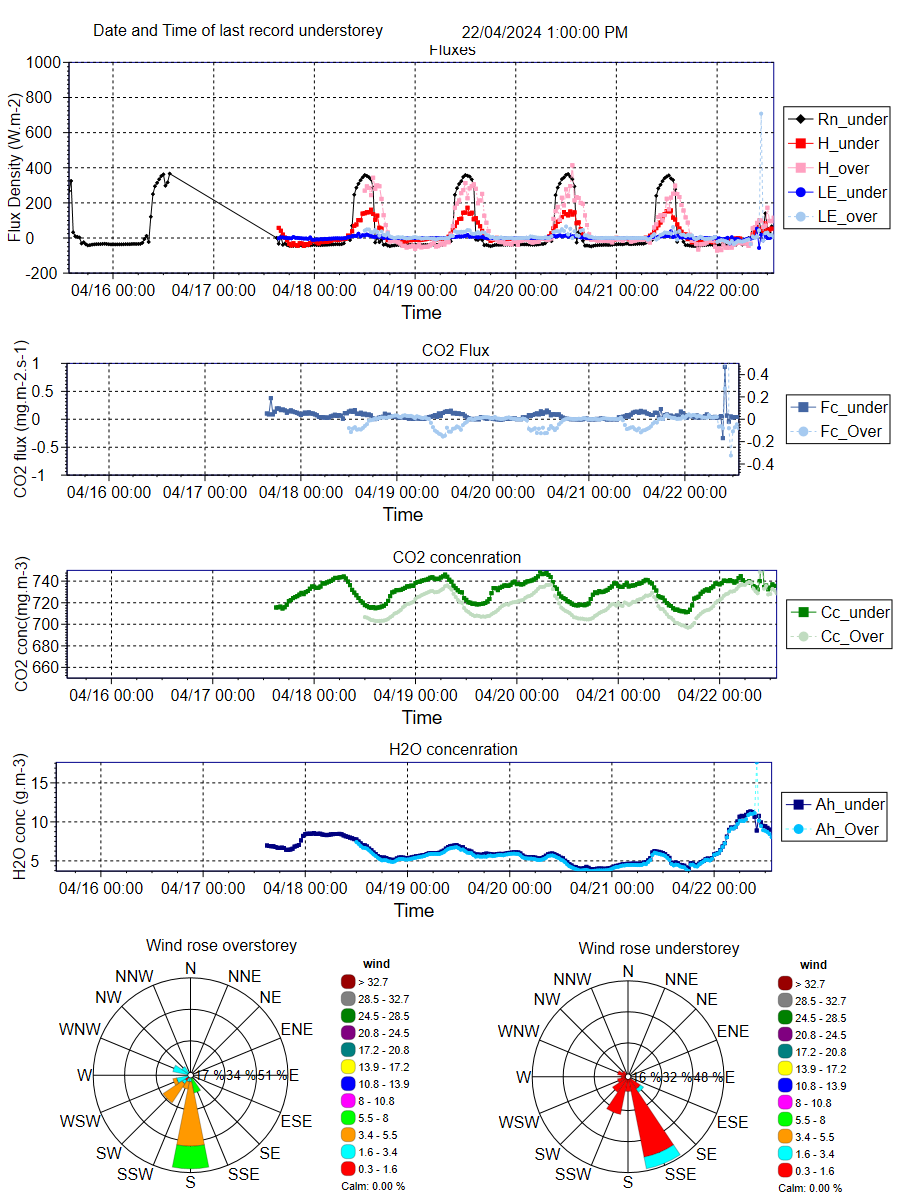
- Understorey
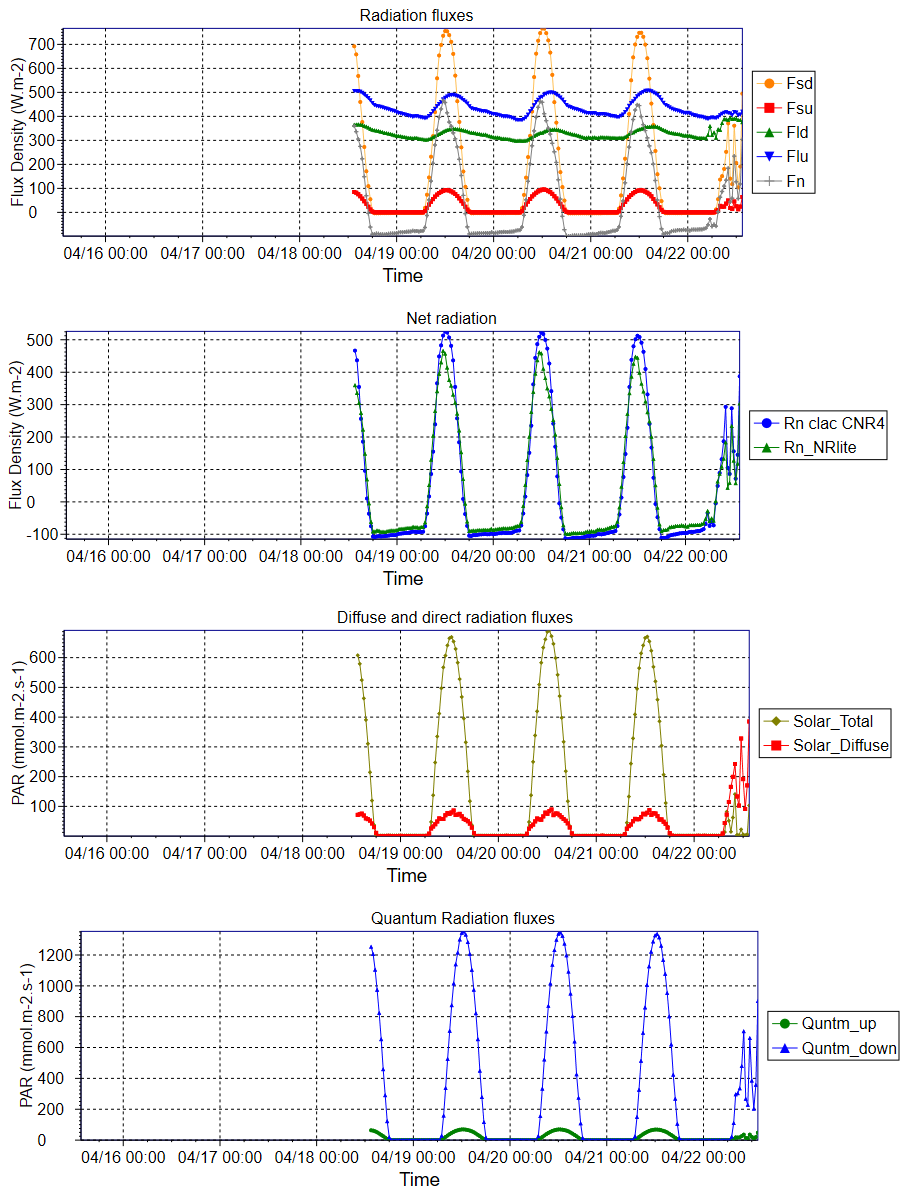
- Radiation
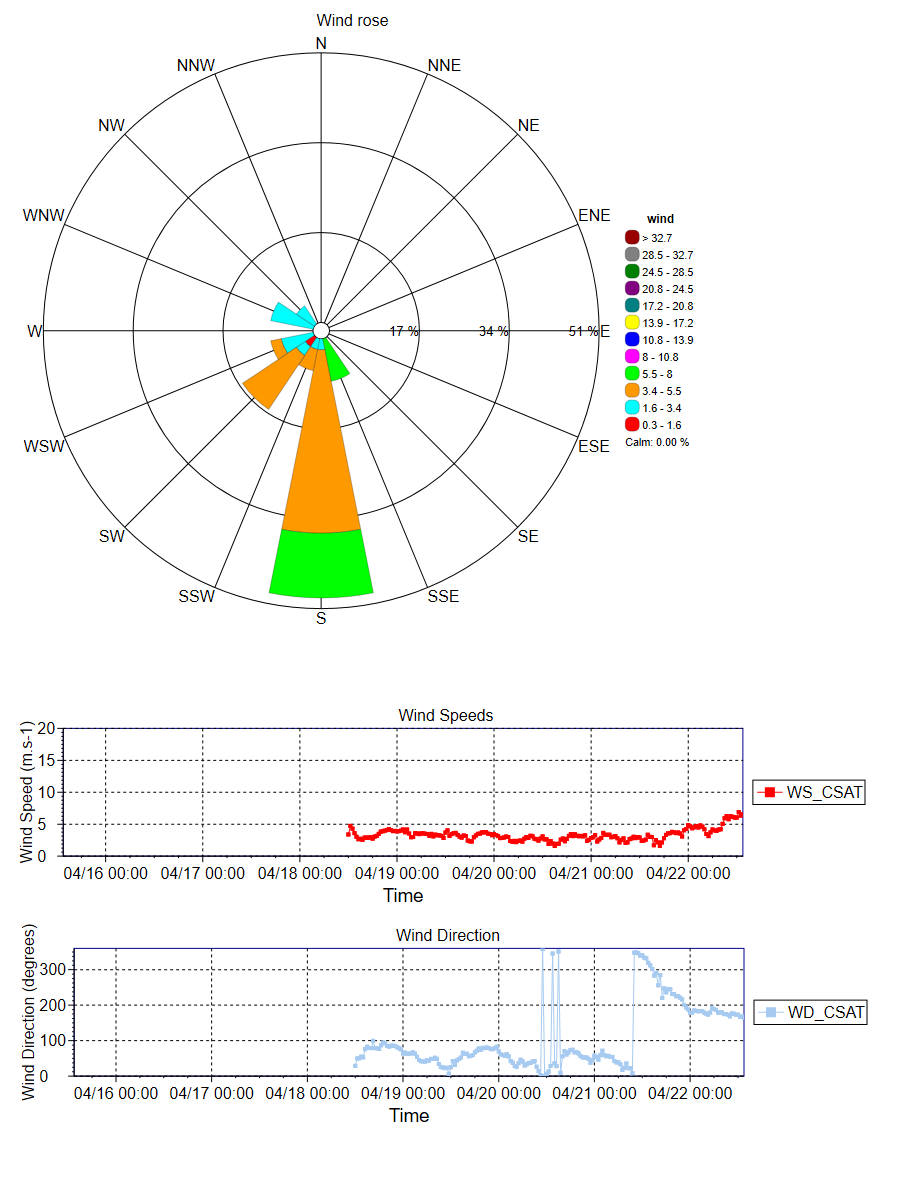
- Wind
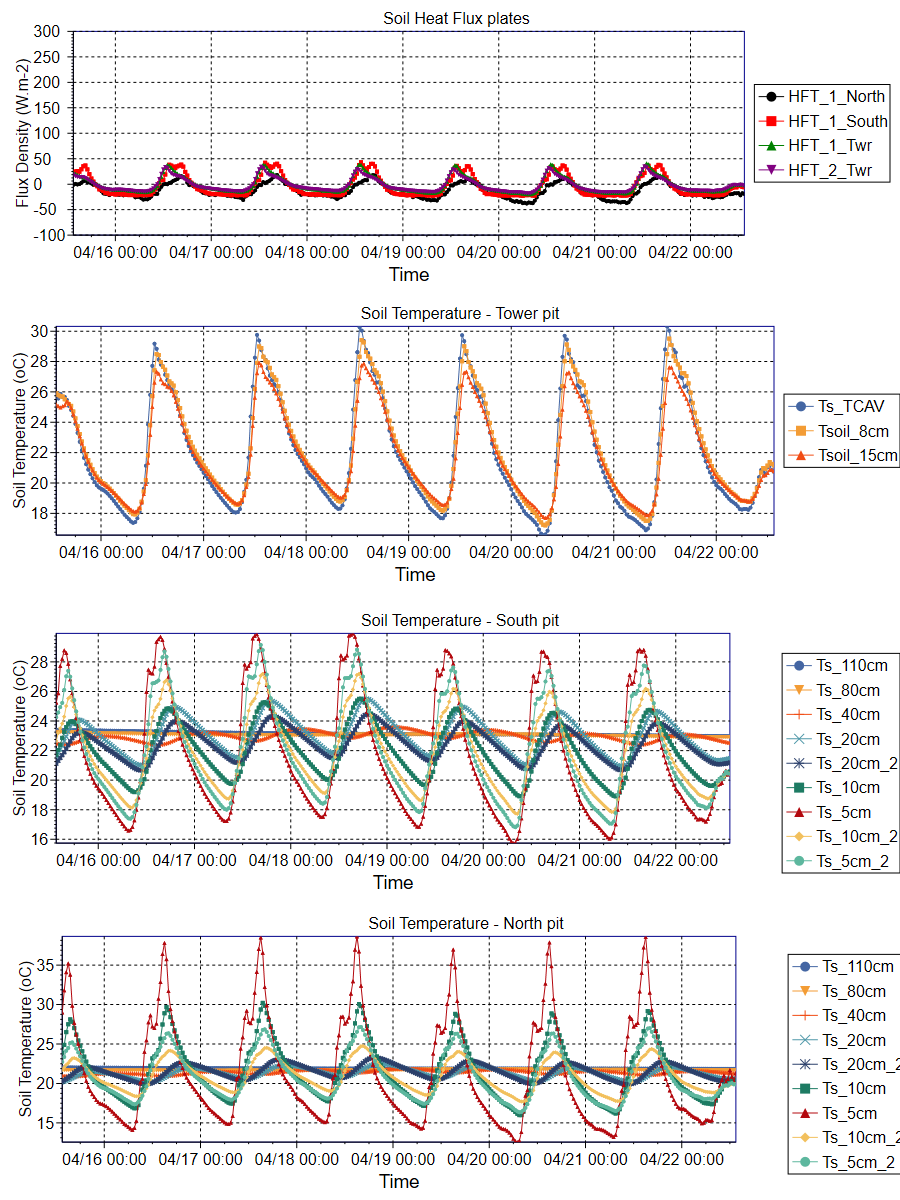
- Soil Temps
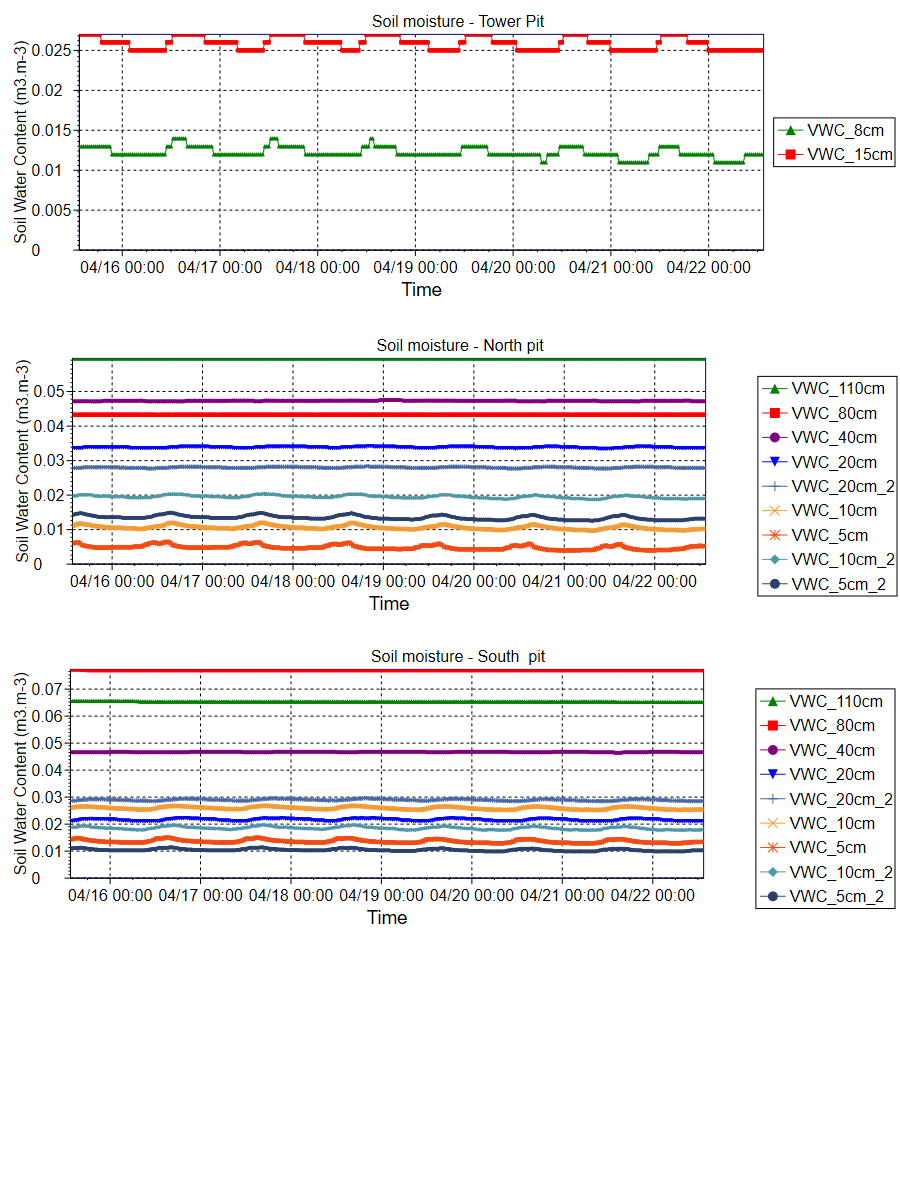
- Soil moist
- Met
- Diags
- Specs
- Camera
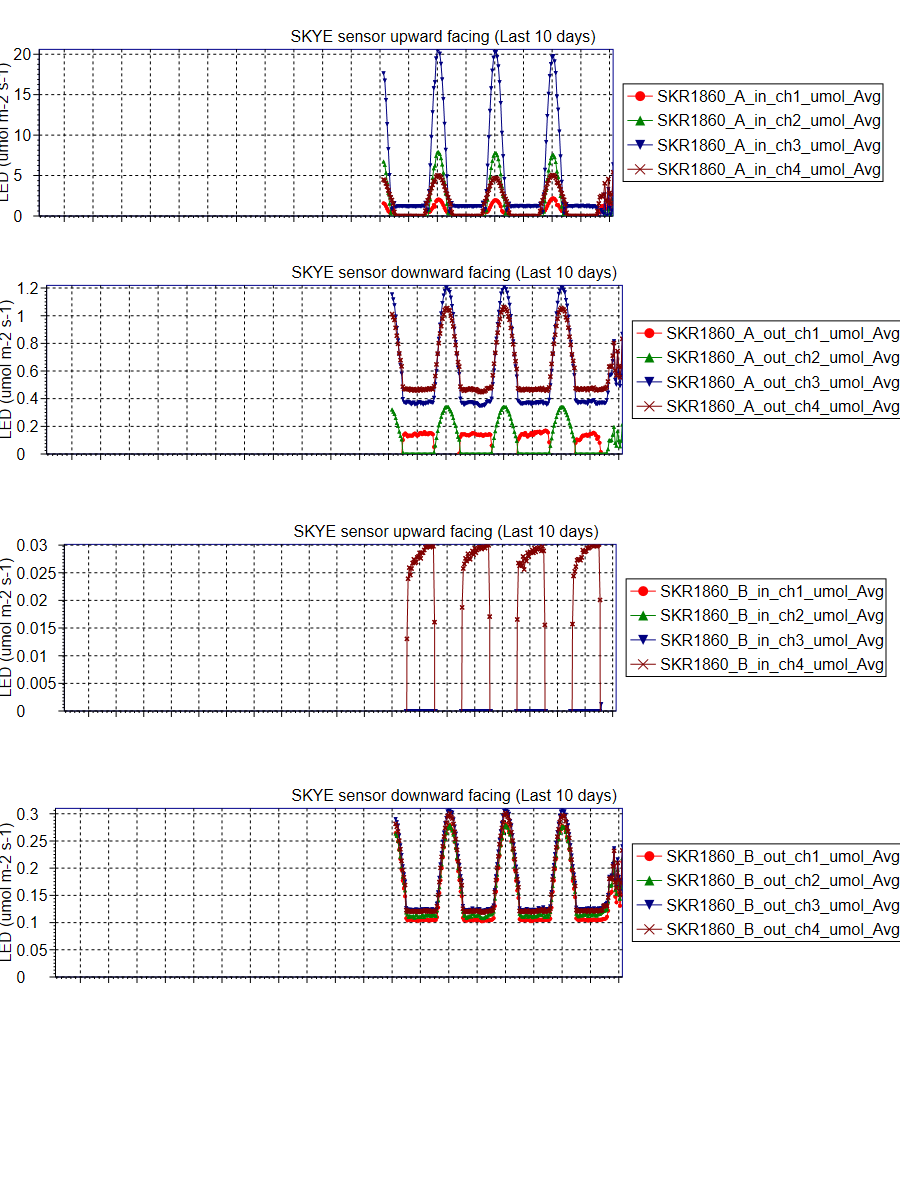
- Skye Multi
- MODIS
Investigators and Partners
This project is the product of the combined efforts of many interdisciplinary researchers of various expertise and is currently operated by:
- Prof Jason Beringer (Micrometeorology)(UWA)
Project Overview
The Wheatbelt supports $2.7b from cropping/grazing and contains biologically significant landscapes that face significant challenges in a changing environment. This project provides an understanding of vegetation production, soil greenhouse gasses and water use from agricultural and forest lands thereby helping to make agriculture more efficient while protecting our natural systems. We will monitor and determine the balance of environmental demands for water yields, agricultural productivity, carbon storage and biodiversity within a catchment landscape. Therefore we will aid the sustainable management of natural resources, foster ecotourism and enhance food security.
The site provides nationally consistent observations of vegetation dynamics, faunal biodiversity, micrometeorology (climate, radiation, fluxes of carbon and water), hydrology and biogeochemistry to examine the impacts of disturbance, climate on carbon stocks and GHG emissions, and impacts on habitat quality via ongoing monitoring of vegetation structure and fauna. A wide range of ground based observations of vegetation structure and floristics is planned and all will link to remote sensing of fire and vegetation change over time. Measurements of carbon sequestration through time will be achieved via the instrumentation capable of directly measuring CO2, water use and surface energy properties (energy balance, reflectance).
The tower will provide longterm measurements as part of the Ozflux network and the infrastructure is partly funded through the NCRIS TERN OzFlux facilities.
Key research questions
These questions are embedded within a much larger overarching question about "How do intensively managed landscapes in WA alter hydrology, geomorphology, biology, and biogeochemistry?". Such a question is inherently multidisciplinary and can be understood through the lens of ‘critical zone science’. Our second major aim is to undertake this project under the scientific framework of critical zone science and through this project establish the first element of a much larger critical zone observatory (CZO).
The Site Location
The Boyagin flux station is located approximately 12km west of Pingelly, near Perth, Western Australia. It was established in September 2017 and is managed by The University of Western Australia. The Boyagin OzFlux Site is located at: 32.477093 S, 116.938559 E, and 484m elevation.
Site Characteristics
The flux tower site is located within an area of wandoo woodland. The surrounding area is dominated by broadacre farming practices.
Elevation of the site is close to 484 m. Climate information comes from the nearby Pingelly BoM AWS station 010626 (1991 to 2016) and shows mean annual precipitation is approximately 445 mm with highest rainfall in June and July of 81 mm each month. Maximumum and minuimum annual rainfall is 775 and 217 mm, respectively. Maximum temperatures range from 31.9°C (in Jan) to 15.4°C (in July), while minimum temperatures range from 5.5°C (in July) to 16.0 °C (in Feb).
Data
Data from this site is available through the OzFlux data portal international FLUXNET database or via the investigators email jason.beringer[@]uwa.edu.au
Further Information
- Prof. Jason Beringer homepage
- School of Earth and Environment
- The Australian Flux Network (OzFlux)
- Critical Zone Exploration Network
- The Terrestrial Ecosystem Science Network (TERN)
- The Terrestrial Ecosystem Science Network (TERN) Supersite network
- The National Collaborative Research Infrastructure Strategy (NCRIS)
- The International FLUXNET
Acknowledgements
This site is produced by Prof. Jason Beringer, UWA, School of Earth and Environment and proudly part of the Australian Flux Network(OzFlux) and partly supported by the Australian NCRIS Terrestrial Ecosystem Research Network (TERN).
Google Map
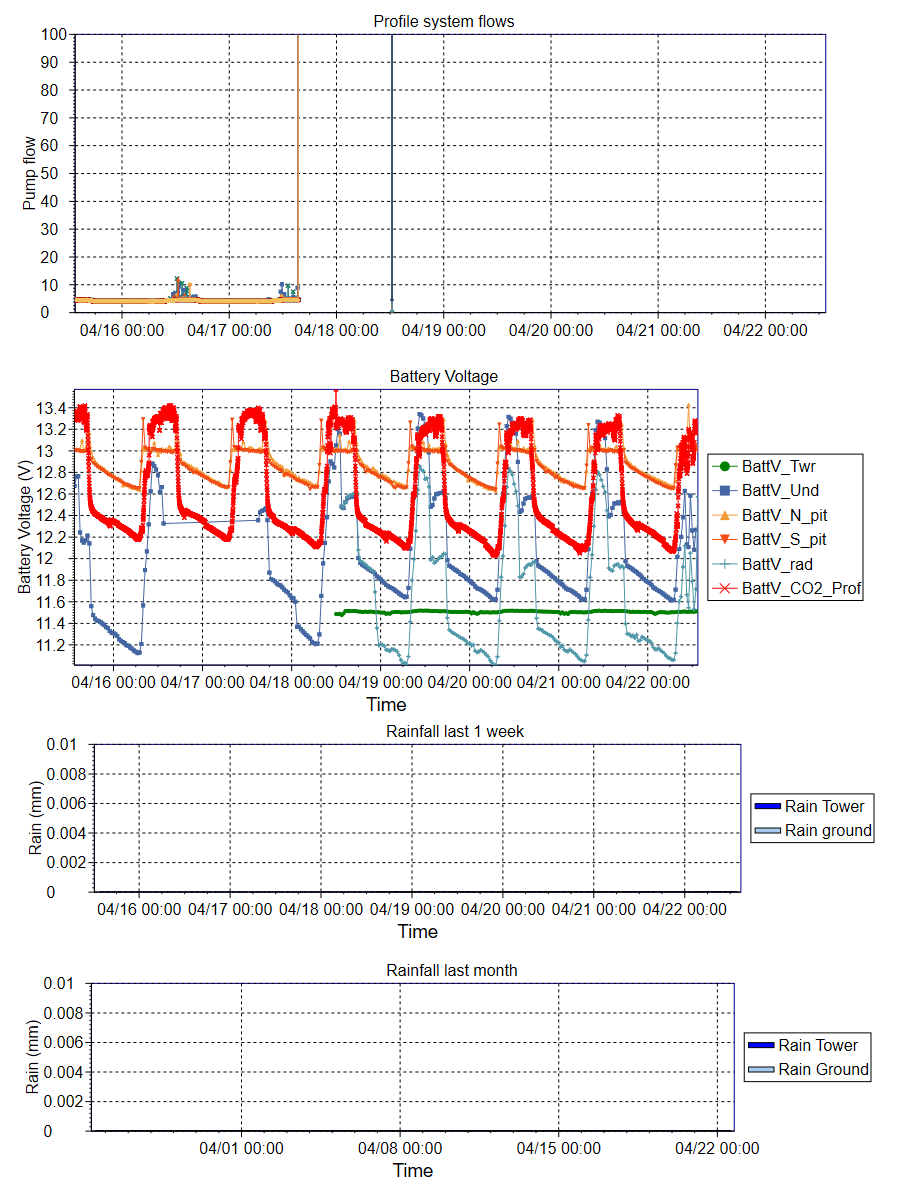
Instrument |
Make |
Model |
Description |
Atmospheric Pressure |
Vaisala |
CS106 |
2.5m |
Net Radiation |
Campbell Scientific |
CNR4 |
4m |
Data logger |
Campbell Scientific |
CR3000 |
Ground |
Open Path CO2 H2O |
LI-COR |
Li-7500 |
2.5m |
Rain gauge |
Campbell Scientific |
CS702 |
Ground |
Soil heat flux (two replicates) |
Hukseflux |
HFP01 |
0.1m |
Soil temperature |
Campbell Scientific |
TCAV-L |
0.08m |
Sonic anemometer |
Campbell Scientific |
CSAT3 |
2.5m |
Temperature and Relative Humidity (two replicates) |
Vaisala |
HMP45AC |
2.5m |
Soil Moisture (6 replicates) |
Campbell Scientific |
CS616 |
0.1, 0.2, 0.4, 0.8, 1.2, 2.0m |
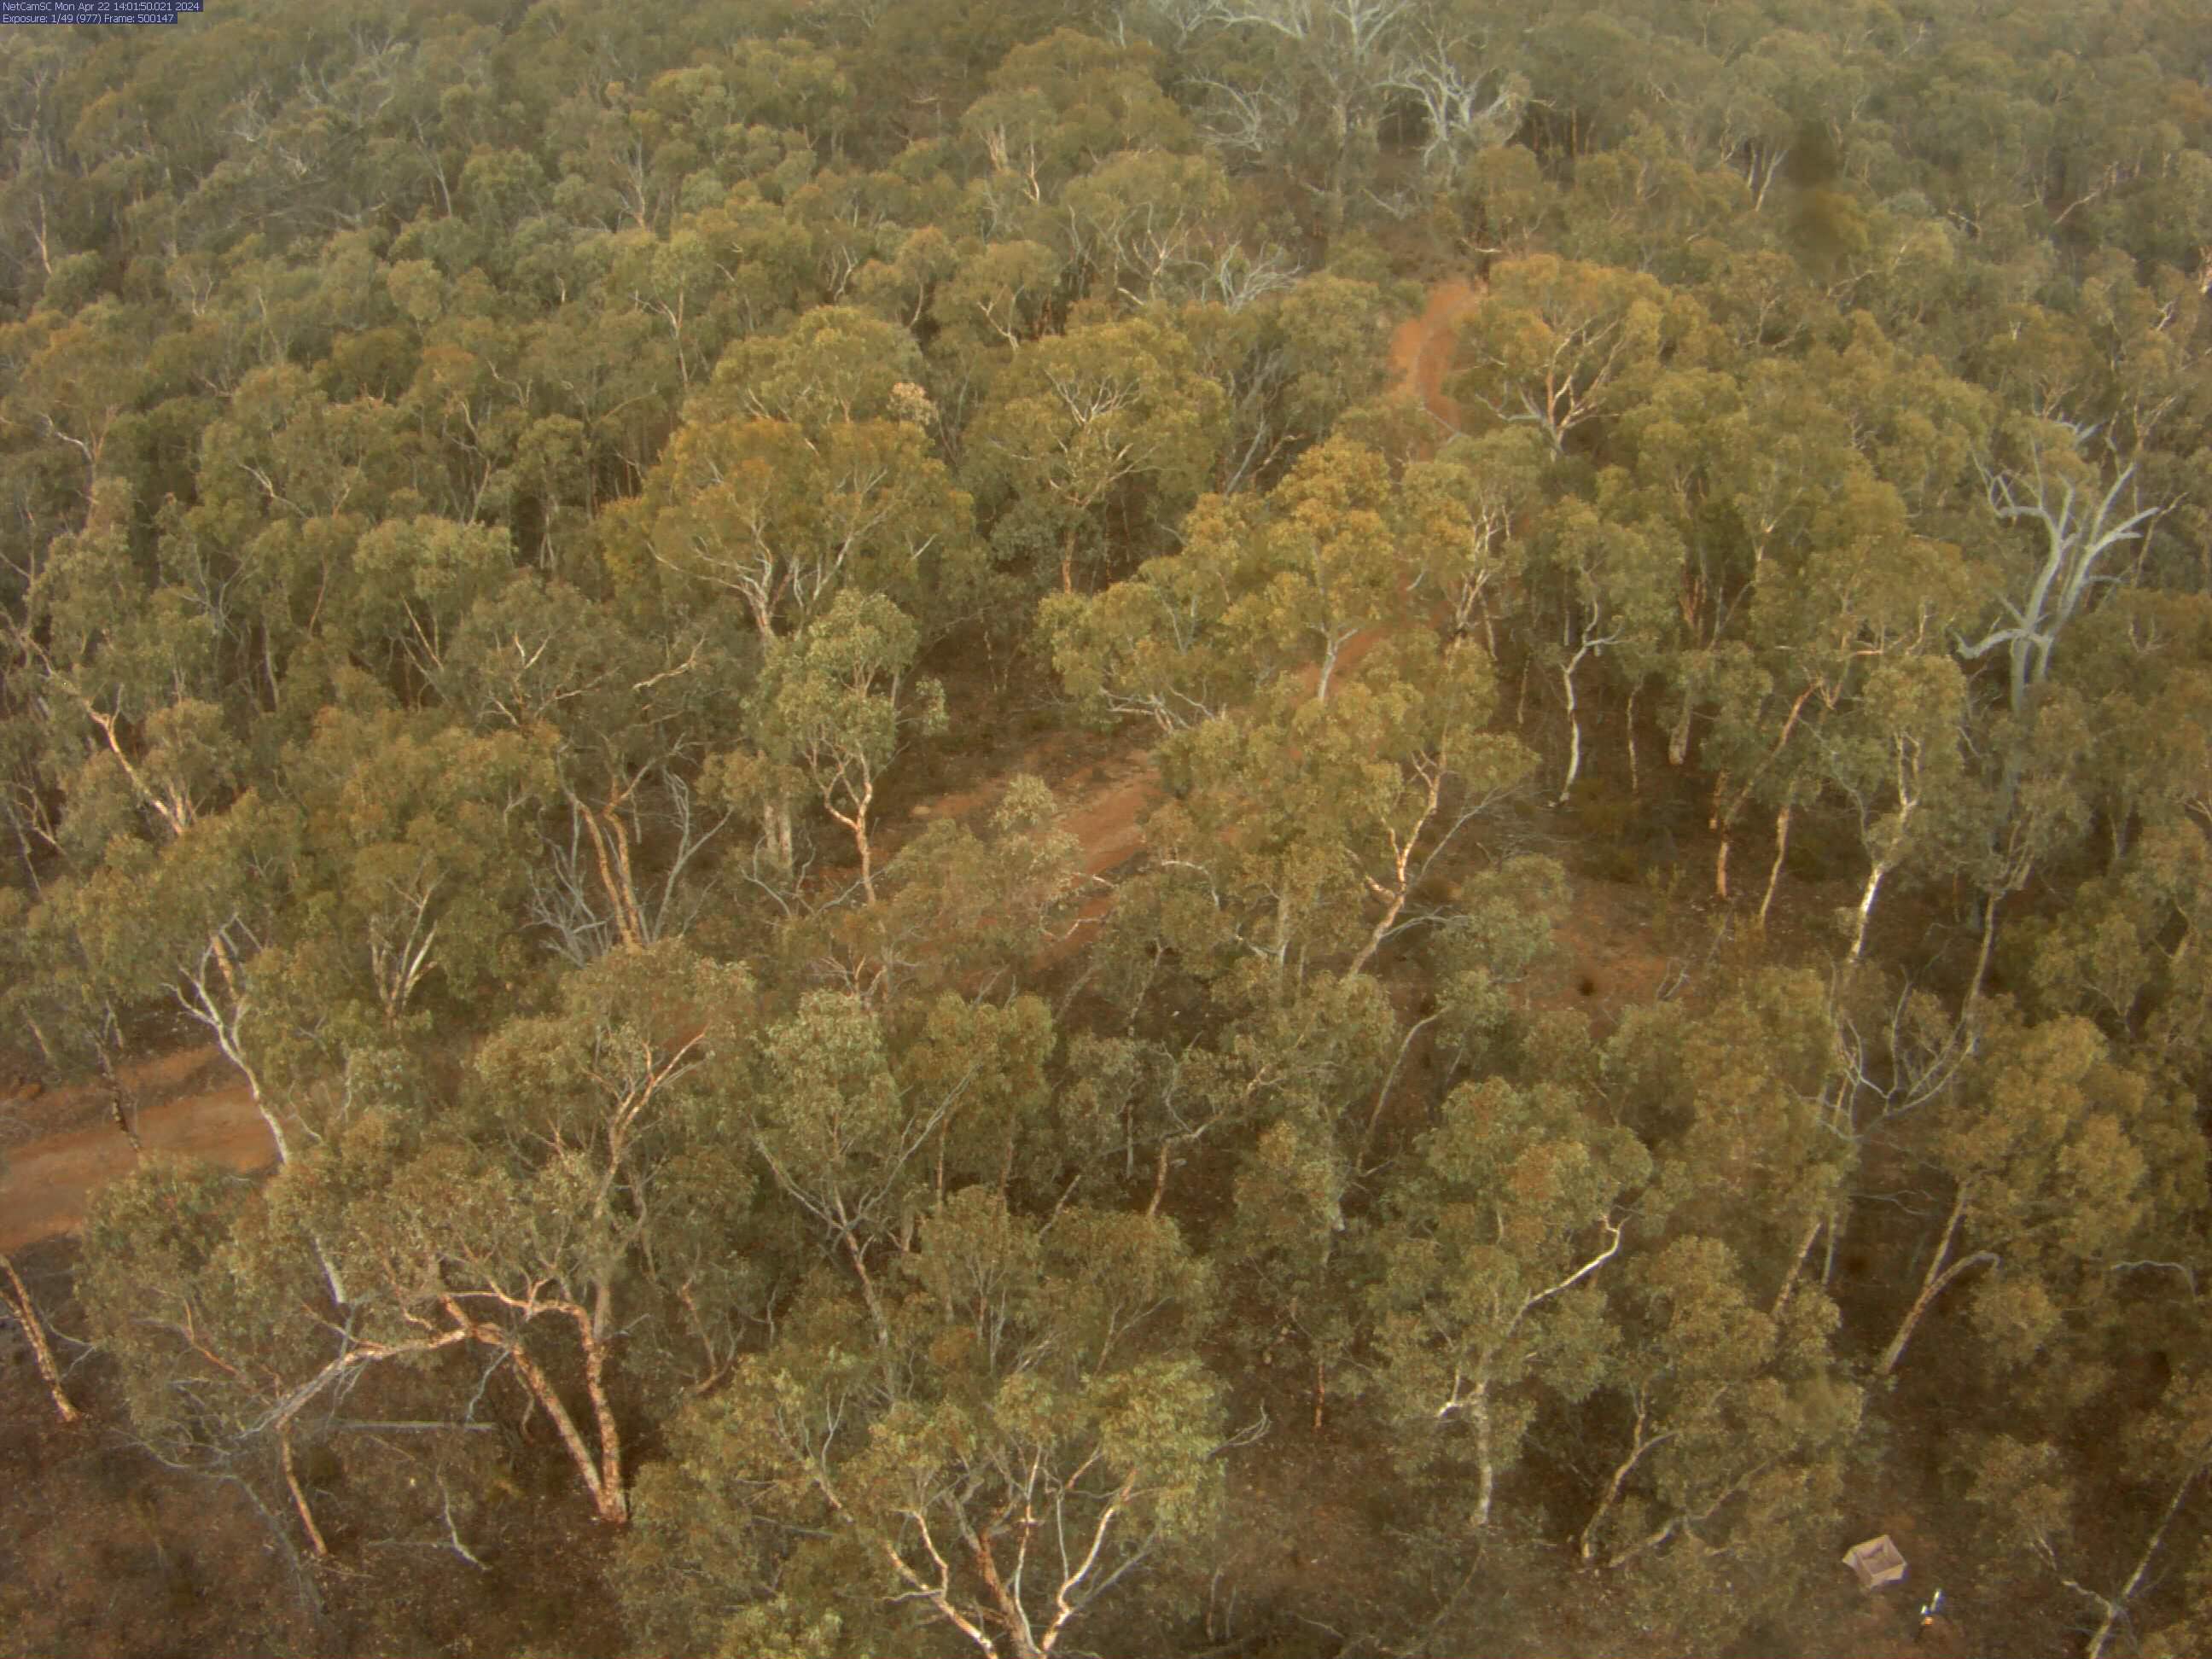
This image is taken by a Vivotek Network Camera (IP8362) and is updated every 30 minutes. The timestamp is provided in Coordinated Universal Time (UTC).
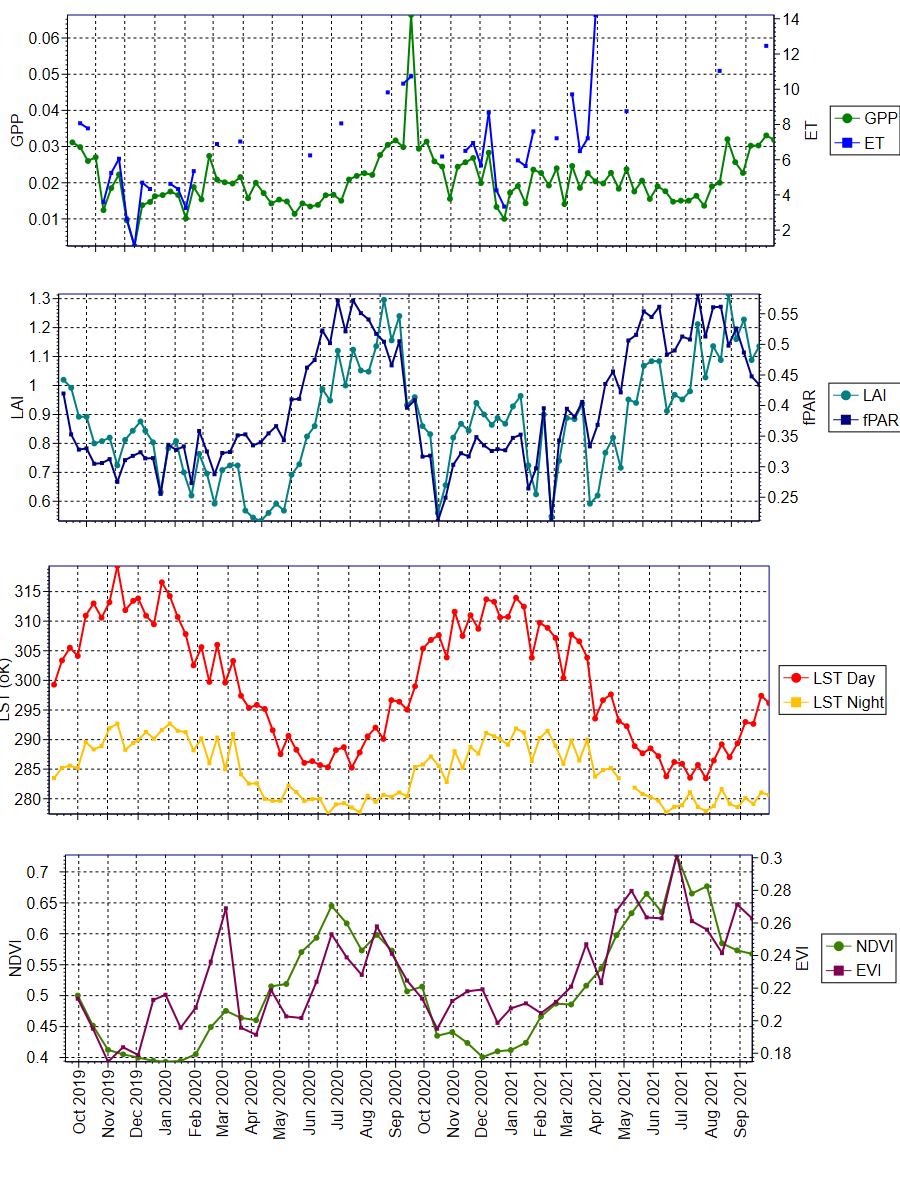
The data was obtained from the Oak Ridge National Laboratory Distributed Active Archive Center for Biogeochemical Dynamics (ORNL DAAC) (https://daac.ornl.gov/MODIS/). The ORNL DAAC provides MODIS Land Product Subsets for model validation, site characterisation and remote-sensing purposes.
Daily updated data was obtained from this provider, with an area of 3x3km extracted using Python script written by Mr. Darien Pardinas-Diaz ([email protected]). The plots were produced using QC Filter Conditions 000 and 001. Condition 000 represents the highest QC Filter possible and 001 represents a reliable and usable QC Filter, though not to the standard of 000.

Google Map
University information
CRICOS Code: 00126G