

Land Ecosystem Atmosphere Program (LEAP) - Litchfield Supersite

Investigators and Partners
This project is the product of the combined efforts of interdisciplinary researchers of various expertise:
- Prof Lindsay Hutley (Ecophysiologist)(CDU)
- Prof Jason Beringer (Micrometeorology)(UWA)
- Dr Stefan Maier (Remote sensing)
Project Overview
A Savanna Super Site (SSS) has been established within Litchfield National Park as part of the Australian Supersite Network (www.tern-supersites.net.au) that is supported by the Terrestrial Ecosystem Research Network (TERN, www.tern.net.au). The SSS is a research and monitoring site representative of high rainfall, frequently burnt tropical savanna. Tropical savanna in Australia occupies 1.9 million km2 across the north and given the extent of this biome, understanding biogeochemical cycles, impacts of fire on sequestration, vegetation and fauna is a national priority.
In the NT, savanna ecosystems are largely intact in terms of tree cover, with only modest levels of land use change. Despite this, there is evidence of a loss of biodiversity, most likely due to shifts in fire regimes and a loss of patchiness in the landscape. Approximately 40% of the savanna burn every year and understanding fire impacts on fauna and flora is essential for effective land management. Vast areas, limited infrastructure and human resources makes the role of remote sensing all the more important for land management in north Australia and this super site aims to address these needs by establishing infrastructure at a significant savanna site of uniform topography within a managed national park (Lichfield NP) that makes it ideal for remote sensing as well as flux studies.
The site will provide nationally consistent observations of vegetation dynamics, faunal biodiversity, micrometeorology (climate, radiation, fluxes of carbon and water), hydrology and biogeochemistry to examine the impacts of fire regime, climate on carbon stocks and GHG emissions, and impacts on habitat quality via ongoing monitoring of vegetation structure and fauna. A wide range of ground based observations of vegetation structure and floristics is planned and all will link to remote sensing of fire and vegetation change over time. Measurements of carbon sequestration and remote sensing properties of vegetation through time will be achieved via the installation of a 40 m guyed tower equipped with instrumentation capable of directly measuring CO2, water use and surface energy properties (energy balance, reflectance). Co-location of Flux observations and remote sensing systems will be co-located to provide TERN with a ground-/air-/space based remote sensing observation stream. This will enable the development of tools describing fire occurrence, severity and associated greenhouse gas emissions, evapotranspiration and carbon sequestration.
On-going fauna and flora monitoring will be undertaken at 5 sites within the SSS footprint that are component sites of the ‘3 Parks’ data base, a long-term (15 years+) monitoring program across the 3 major national parks of the NT (Kakadu, Nitmiluk and Litchfield National Parks) that is examining the effects of fire frequency on vegetation structure and woody growth rates. Fire management, both protective and experimental burning regimes will be implemented across the SSS to assess impacts of fire on flora, fauna and biogeochemical cycles in savanna.
Key research questions
The tower will provide longterm measurements as part of the Ozflux network .
The infrastructure is funded through the NCRIS TERN Supersites and OzFlux facilities
The Site Location
Litchfield Supersite Latitude: -37.731 S Longitude: 145.015 E
Data
Data from this site is available through the OzFlux data portal international FLUXNET database or via the investigators email [email protected]
Further Information
- Prof. Jason Beringer homepage
- School of Earth and Environment
- Charles Darwin University
- The Australian Flux Network (OzFlux)
- The Terrestrial Ecosystem Science Network (TERN)
- The Terrestrial Ecosystem Science Network (TERN) Supersite network
- The National Collaborative Research Infrastructure Strategy (NCRIS)
- The International FLUXNET
Acknowledgements
This site is produced by Prof. Jason Beringer, UWA, School of Earth and Environment and proudly part of the Australian Flux Network(OzFlux) and supported by the Australian NCRIS Terrestrial Ecosystem Research Network (TERN). Australian Research Council grants supported this work (LP0990038 and FT110100602)
Instrument |
Make |
Model |
Description |
Atmospheric Pressure |
Vaisala |
CS106 |
2.5m |
Net Radiation |
Campbell Scientific |
CNR4 |
4m |
Data logger |
Campbell Scientific |
CR3000 |
Ground |
Open Path CO2 H2O |
LI-COR |
Li-7500 |
2.5m |
Rain gauge |
Campbell Scientific |
CS702 |
Ground |
Soil heat flux (two replicates) |
Hukseflux |
HFP01 |
0.1m |
Soil temperature |
Campbell Scientific |
TCAV-L |
0.08m |
Sonic anemometer |
Campbell Scientific |
CSAT3 |
2.5m |
Temperature and Relative Humidity (two replicates) |
Vaisala |
HMP45AC |
2.5m |
Soil Moisture (6 replicates) |
Campbell Scientific |
CS616 |
0.1, 0.2, 0.4, 0.8, 1.2, 2.0m |
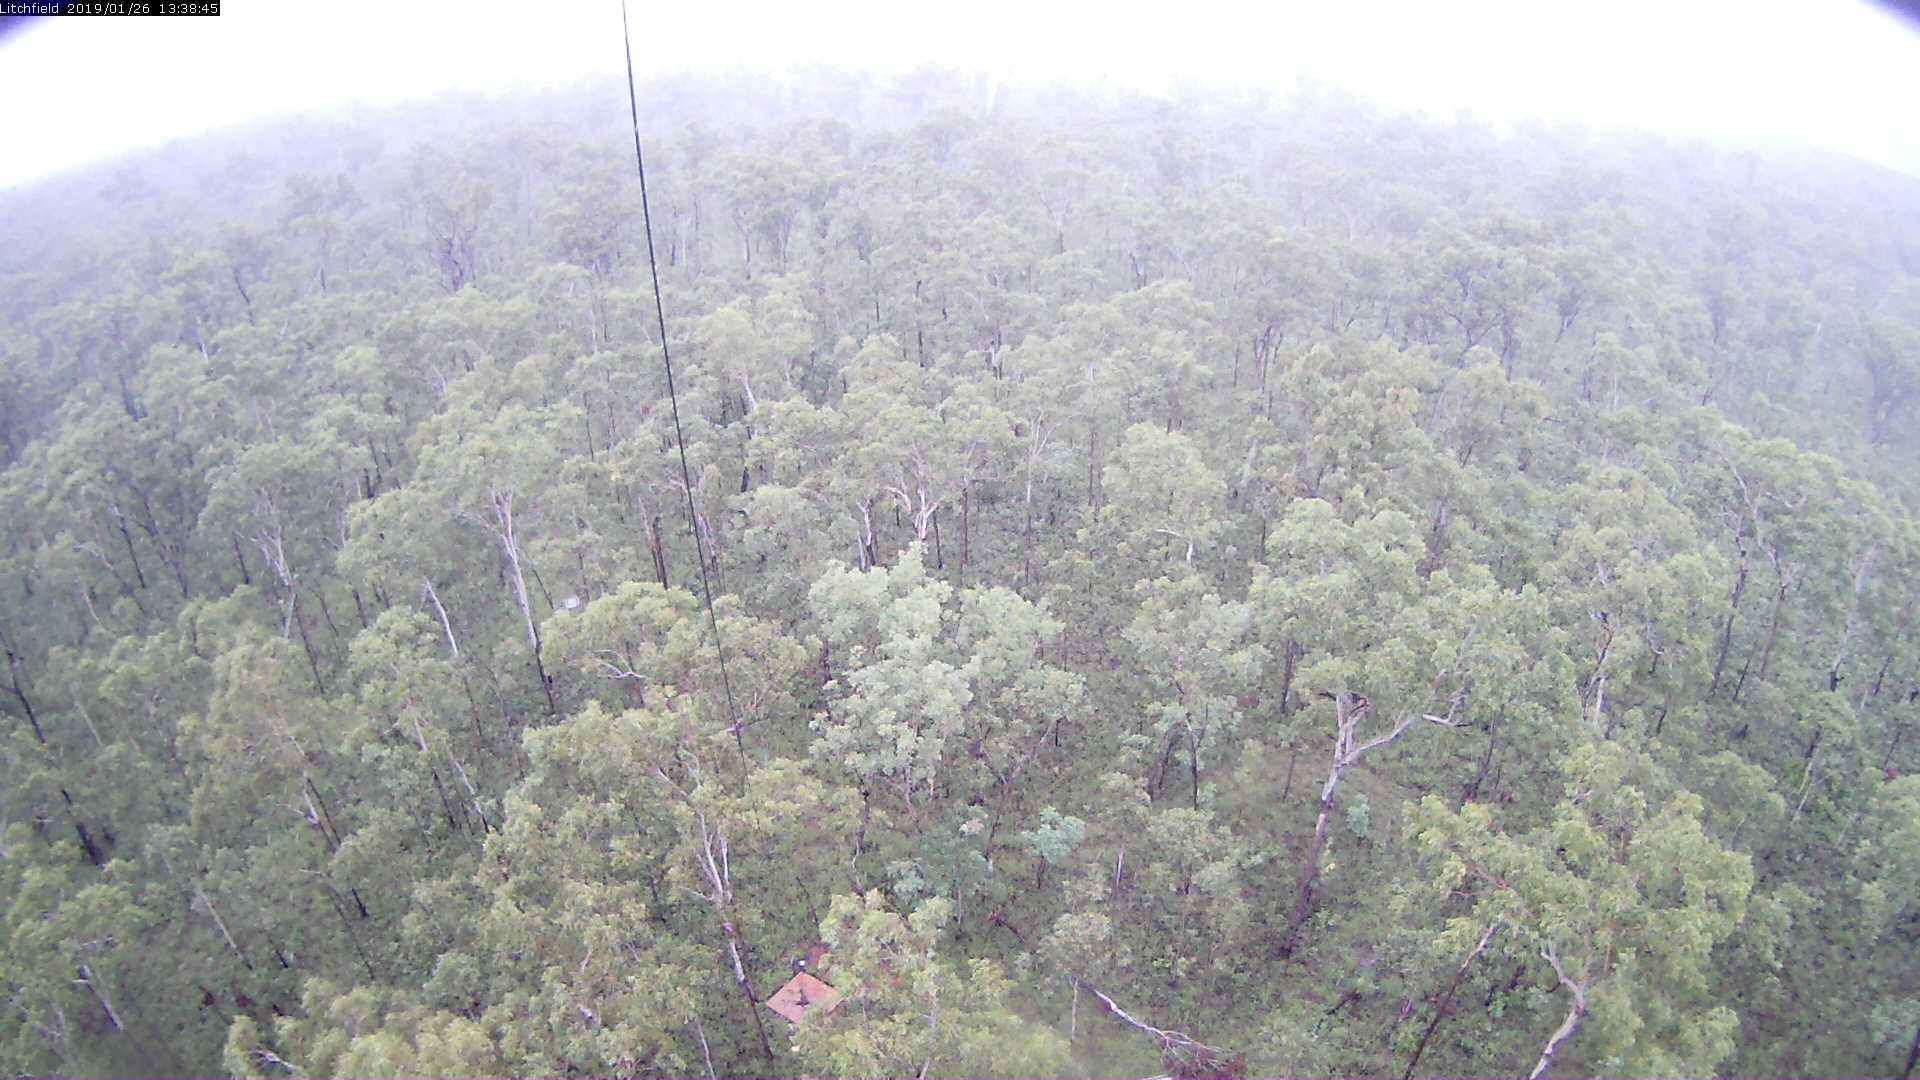
This image is taken by a Vivotek Network Camera (IP8362) and is updated every 30 minutes. The timestamp is provided in Coordinated Universal Time (UTC).
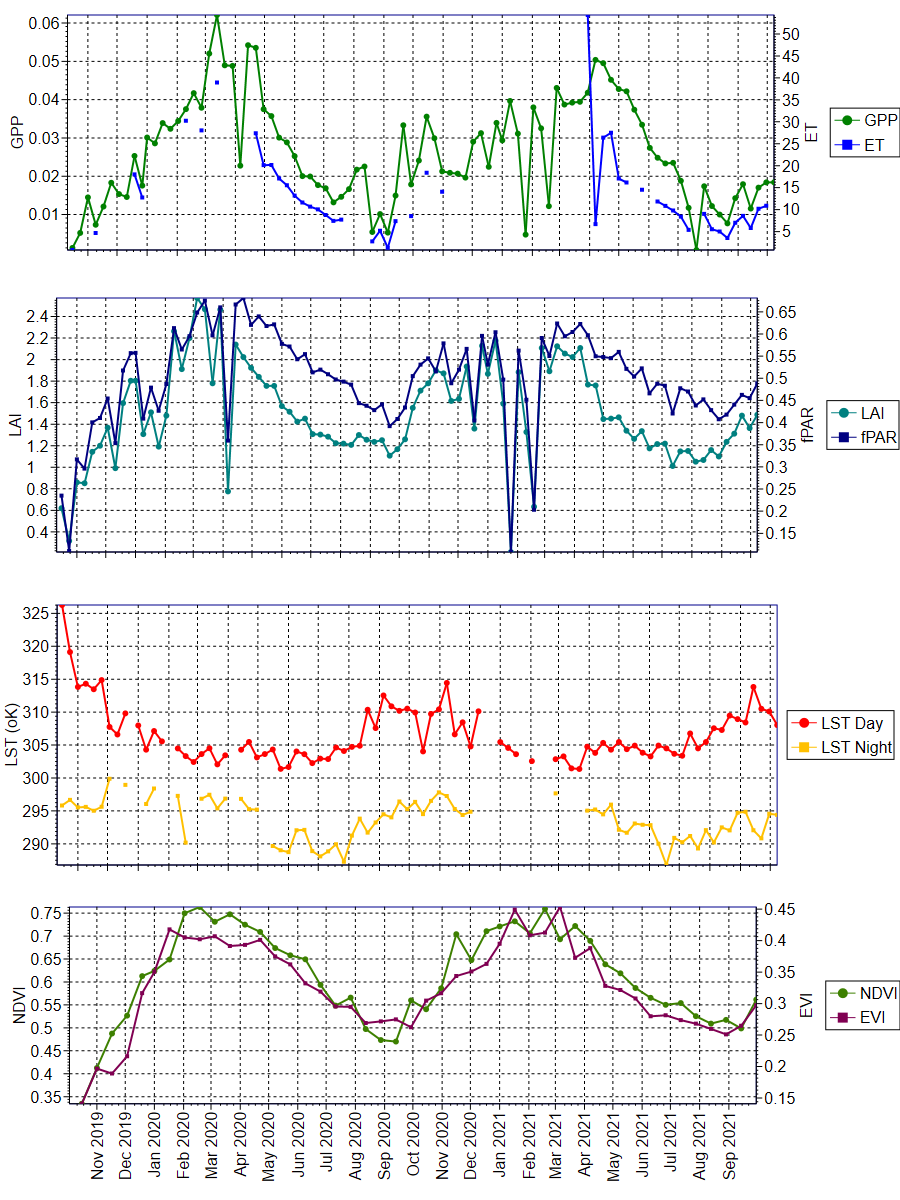
The data was obtained from the Oak Ridge National Laboratory Distributed Active Archive Center for Biogeochemical Dynamics (ORNL DAAC) (https://daac.ornl.gov/MODIS/). The ORNL DAAC provides MODIS Land Product Subsets for model validation, site characterisation and remote-sensing purposes.
Daily updated data was obtained from this provider, with an area of 3x3km extracted using Python script written by Mr. Darien Pardinas-Diaz ([email protected]). The plots were produced using QC Filter Conditions 000 and 001. Condition 000 represents the highest QC Filter possible and 001 represents a reliable and usable QC Filter, though not to the standard of 000.

University information
CRICOS Code: 00126G